
Kindle + Python = e-Ink Dashboard (part 2)
repurposing an old kindle paperwhite 3
In the last post a Kindle Paperwhite 3 was jailbroken, Python 3.8 installed and all boilerplate code was added to have a way to start our script and launch it from KUAL. Now we can actually dive into the actual Python code that will turn the device in a proper DashBoard. To do this we’ll create a miniature ETL pipeline (Extract - Transform - Load), that will fetch data from relevant websites (the extract part), combine it into a dictionary (the transform) and put all parts in an SVG image (the load). The latter can then be converted into a PNG which we can show on the screen.
As always, all code for this project can be found on GitHub.
Coding the Extract Functions
I have plenty of devices telling me the weather forecast, so I didn’t want to do yet another weather dashboard. Matter of fact, a lot of the code here is based on a KUAL Extension that does exactly that. Check it out here if you are looking to do a weather dashboard. I’ll pick something more specific for me, but it should be relatively easy to adapt the code to other websites and API’s to make a dashboard tailored to your own interests.
After some thinking I decided to pull data from three websites; Google Scholar to grab the number of citations my publications have received as well as my H-index, my current Gwent rank and score (a competitive online card-game) and from TVMaze air dates of upcoming episode for series I like. To avoid making the installation of this extension overly complicated, no additional packages will be used, so only the standard library will be used. Unfortunately, this means getting websites with urllib and regular expressions rather than requests and BeautifulSoup. Though, moving some complexity from the installation (jailbreaking a Kindle to get this to run is hard enough already) to the code is an acceptable trade-off.
Grabbing Data from Google Scholar
All functions to grab and parse data from websites is contained in extract.py, my Google Scholar page is the
easiest to parse so let’s start there.
import ssl
import urllib.request
import re
import json


def get_google_scholar(url):
    ssl_context = ssl._create_unverified_context()
    with urllib.request.urlopen(url, context=ssl_context) as response:
        html = response.read()

    hits = re.findall(r'<td class="gsc_rsb_std">(\d+)</td>', str(html))
    fields = ['citations', 'citations_recent', 'h_index', 'h_index_recent', 'i10_index', 'i10_index_recent']

    return dict(zip(fields, hits))
As far as getting and parsing an html page goes, this couldn’t be more straightforward. We use urllib to get the html data and with a single regular expression can get all fields in the table with the citation statistics. This should give us six hits on each page and by using the zip and dict function it is possible to quickly merge those hits with the correct names for the fields.
One odd thing is that the ssl_context needs to be created and added to the request. While the code works fine on my computer without, it gives an error on the Kindle without this bit included.
Getting the Gwent Profile Data
While a few simple lines sufficed for Google Scholar, getting the data from my Gwent profile contains a lot more ugly code. Here the lack of a proper package to parse HTML, like BeautifulSoup, is really tangible. However, while not the prettiest code, it get’s the job done. It is just a matter of finding the spot in the HTML code where the piece of information is located and writing up a regular expression to parse it out.
def get_gwent_data(url):
    ssl_context = ssl._create_unverified_context()
    with urllib.request.urlopen(url, context=ssl_context) as response:
        html = response.read()

    output = {
        'player':   ''.join(re.findall(r'<strong class="l-player-details__name">\\n\s+(.*?)</strong>', str(html))),
        'mmr':      ''.join(re.findall(r'<div class="l-player-details__table-mmr">.*?<strong>(.*?)</strong></div>', str(html))).replace(',',''),
        'position': ''.join(re.findall(r'<div class="l-player-details__table-position">.*?<strong>(.*?)</strong></div>', str(html))).replace(',',''),
        'rank':     ''.join(re.findall(r'<span class="l-player-details__rank"><strong>(.*?)</strong></span>', str(html))),
        'ladder':   ''.join(re.findall(r'<div class="l-player-details__table-ladder" ><span>(.*?)</span></div>', str(html))),
    }

    return output
Note that re.findall returns a list of all hits, which should contain one element here. Though rather than extracting that hit with its index, the join function is used. Due to this little trick, if the Gwent website is updated and the regular expression won’t match the code won’t yield errors, it will just have an empty strings as values. If the values no longer appear on the dashboard it is time to revise the code, but the other items will still work as planned.
TVMaze
TVMaze has an API that returns JSON objects, so that is easy to convert to a dict and doesn’t need messing around with regular expressions to parse out parts of HTML. However, here there is an extra complexity that data for each show (which will be passed to the function as a list of IDs) has to be fetched first. If that contains a link to the upcoming episode we need to get that endpoint additionally to find the name of the episode and the airdate.
def get_tvmaze_data(ids):
    output = []

    ssl_context = ssl._create_unverified_context()
    for id in ids:
        url = 'http://api.tvmaze.com/shows/%d' % id
        with urllib.request.urlopen(url, context=ssl_context) as response:
            data = json.load(response)
            links = data.get('_links', {})
            if 'nextepisode' in links.keys():
                with urllib.request.urlopen(links['nextepisode']['href'], context=ssl_context) as episode_response:
                    episode_data = json.load(episode_response)
                    output.append(
                        {
                            'name': data.get('name', 'error'),
                            'episode_name': episode_data.get('name', 'error'),
                            'airdate': episode_data.get('airdate', 'error'),
                        }
                    )

    return sorted(output, key=lambda x: x['airdate'])
Caching and Catching Errors with a Decorator
Most sites don’t provide new data every hour, so there is no need to fetch the data that often. We can simply store the results and the next time we refresh check the time since the last modification. If that is recent enough we load the data and provide that. If the file is older than the chach time, we fetch new data from the internet.
As the data comes from the internet a few things can go wrong, the Kindle’s Wifi might not come up fast enough, or the internet might be down, or one of the websites times out … and these errors aren’t caught yet. I also don’t want the dashboard to display empty information for an hour or more because one website was temporarily unreachable. Here we can also leverage the cache, if we fail to get up to fetch data from the internet, we load the cache regardless of the age and show that. It is better to show (slightly) out of date information than no information at all.
The decorator shown below elegantly combines both of these, note there is some boiler plate code for checking the last
modification to a file. This part of the code is included in ./dashboard/bin/cache.py
import json
import os
from datetime import datetime
from functools import wraps

cache_dir = '/mnt/base-us/extensions/dashboard/cache/' if os.name != 'nt' else '../cache'


def hours_since_last_modification(file_path):
    """"
    Returns the number of hours since a file was modified. -1 indicates the file doesn't exists
    """
    if os.path.exists(file_path):
        last_modification = os.stat(file_path).st_mtime
        return (datetime.now().timestamp() - last_modification) / 3600
    else:
        return -1


def cache(cache_file, cache_time):
    """
    Decorator that combine two things:
        * if the decorated function fails (for any reason) it will pull the most recent data
        from cache and return those.
        * if the cache file is more recent than cache_time and return the
        cached data if the file is recent enough

    :param cache_file: File to write cache to
    :param cache_time: How long (in hours) a file should be cached
    """

    def deco_cache(f):
        @wraps(f)
        def f_cache(*args, **kwargs):
            hslm = hours_since_last_modification(cache_file)
            if 0 <= hslm < cache_time:
                with open(cache_file, 'r') as fin:
                    output = json.load(fin)
                return output

            try:
                output = f(*args, **kwargs)
                with open(cache_file, 'w') as fout:
                    json.dump(output, fout)
            except:
                with open(cache_file, 'r') as fin:
                    output = json.load(fin)
            return output

        return f_cache

    return deco_cache
To get this running we’ll need to decorate the extract functions like shown below. The decorator takes one argument, the filename to write to (potentially this could be done automatically based on the decorated function’s name).
# ...
from dashboard.bin.cache import cache_dir, cache
# ...

@cache(join(cache_dir, 'scholar.json'), 8)
def get_google_scholar(url):
    # ...

@cache(join(cache_dir, 'gwent.json'), 1)
def get_gwent_data(url):
    # ...
Time to Transform and Load
So now we have to finish run.py which will be called by the shell script every hour, run the extract functions,
combine the output and visualize it. An easy way to create a dashboard is using an SVG file that looks exactly the way
you like, but with a token in spots
where you want the dynamic text and values to appear. I’ve used this trick before and this is also what was used in the
weather dashboard I’ve been using as a reference for this project. This is very easy code-wise, just see the updated
run.py below. All extracted data is combined in a dict, ./svg/template.svg is loaded as a text file and all the
tokens are replaced by the values to display. Finally, the output is written to disk. There is one line of code that
will check if the operating system is windows and adjust the path accordingly. This is useful for debugging as I can
execute the code on my main machine without issues.
# bin/python3
# encoding: utf-8
from datetime import datetime
import os
from os.path import join
from extract import get_google_scholar, get_gwent_data, get_tvmaze_data
scholar_url = "http://scholar.google.com/citations?user=4niBmJUAAAAJ&hl=en"
gwent_url = "http://www.playgwent.com/en/profile/sepro"
tvmaze_ids = [6, # The 100
79, # The Goldbergs
38963, # The Mandalorian
17128 # This Is Us
]
svg_path = '/mnt/base-us/extensions/dashboard/svg/' if os.name != 'nt' else '../svg'
def create_svg(svg_data, svg_template, svg_output):
with open(svg_template, 'r') as fin:
template = fin.read()
for k, v in svg_data.items():
template = template.replace(k, v)
with open(svg_output, 'w') as fout:
fout.write(template)
def fmt_date(date_input):
d = datetime.strptime(date_input, '%Y-%m-%d')
return d.strftime('%d/%m/%Y')
def is_today(date_input, fmt="%Y-%m-%d"):
return date_input == datetime.now().strftime(fmt)
if __name__ == "__main__":
# Get Data
gs_data = get_google_scholar(scholar_url)
gwent_data = get_gwent_data(gwent_url)
tvmaze_data = get_tvmaze_data(tvmaze_ids)
# Combine into dict
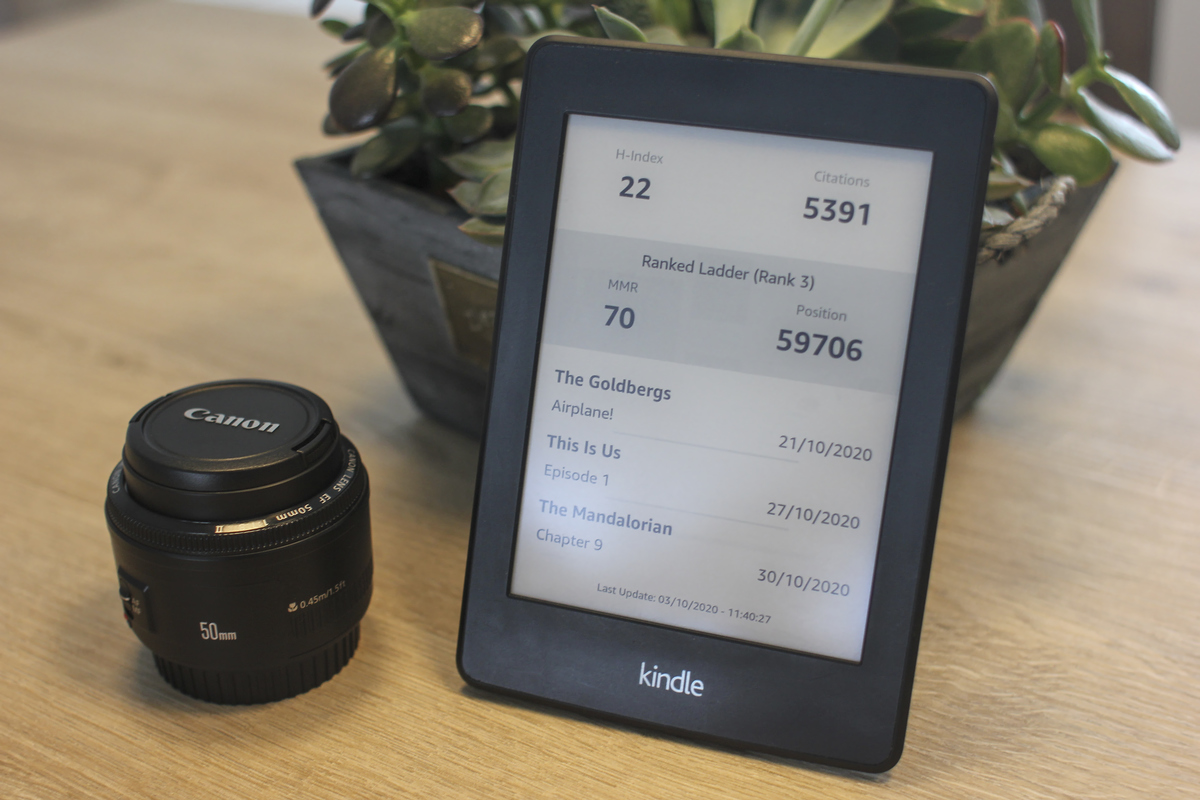
svg_data = {"GS_HINDEX": gs_data.get("h_index"),
"GS_CITATIONS": gs_data.get("citations"),
"GWENT_LADDER_RANK": gwent_data.get("ladder") + (" (Rank " + gwent_data.get("rank") + ")" if "Pro" not in gwent_data.get("ladder") else ""),
"GWENT_MMR": gwent_data.get("mmr"),
"GWENT_POSITION": gwent_data.get("position"),
"LASTUPDATE": "Last Update: " + datetime.now().strftime("%d/%m/%Y - %H:%M:%S")}
for i in range(3):
if i < len(tvmaze_data):
svg_data["TV_SHOW_%d" % (i + 1)] = tvmaze_data[i]["name"]
svg_data["TV_EPISODE_%d" % (i + 1)] = tvmaze_data[i]["episode_name"]
svg_data["TV_AIRDATE_%d" % (i + 1)] = "TODAY" if is_today(tvmaze_data[i]["airdate"]) \
else fmt_date(tvmaze_data[i]["airdate"])
else:
svg_data["TV_SHOW_%d" % (i+1)] = "No upcoming episodes found"
svg_data["TV_EPISODE_%d" % (i + 1)] = ""
svg_data["TV_AIRDATE_%d" % (i + 1)] = ""
# Load Data into SVG
create_svg(svg_data, join(svg_path, "template.svg"), join(svg_path, "tmp.svg"))
Revising start.sh
Now run.py will create a new SVG file each time it is called. However we need to revise start.sh to convert this
SVG into a PNG image and show that image on the screen. The Weather Dashboard uses a combination of rsvg-convert and
pngcruch to create a png file compatible with the Kindle’s own eips command to put it on the screen. Here, the
SVG is still converted using the same tool, but fbink is used, which can put any png image on the screen correctly,
without the need for an additional conversion using pngcruch. Furthermore, the temporary files will be cleaned up in this
script.
One big issue is that the Kindle mounts most partitions with the noexec flag, meaning you can’t execute code and
scripts from there. For scripts that isn’t much of an issue as you can overcome this by starting them through the
interpreter; /bin/sh <scriptname> and python3 <scriptname> can be used for shell and python scripts respectively. To
run rsvg-convert there is a bigger issue as this is a binary file. The workaround here is to copy the executable code
and libraries to a share where code can be executed, here /var/tmp is used, add the path to the libraries to the
environmental variable LD_LIBRARY_PATH and run the program from there.
To avoid flooding KUAL’s log over time (especially fbink is very verbose) all output from the tools is caught and
piped to /dev/null (essentially the command line’s garbage bin) by appending > /dev/null 2>&1 to the command.
#!/bin/sh

cd "/mnt/base-us/extensions/dashboard/"

# Make sure there is enough time to reconnect to the wifi
sleep 30

# Remove files
if [ -f ./svg/tmp.svg ]; then
    rm ./svg/tmp.svg
fi

if [ -f ./svg/tmp.png ]; then
    rm ./svg/tmp.png
fi

# Run script to download data and generate new SVG file
python3 ./bin/run.py

# Copy rsvg-convert to a share where it can be started
# The shared folder that can be accessed via USB is mounted with the noexec flag,
# copying file to /var/tmp gets around this restriction.
if [ ! -f /var/tmp/rsvg-convert ]; then
    cp -rf ./external/* /var/tmp
fi

# Check if svg exists and if it does convert it to PNG and show on screen
if [ -e ./svg/tmp.svg ]; then
  export LD_LIBRARY_PATH=/var/tmp/rsvg-convert-lib:/usr/lib:/lib
  /var/tmp/rsvg-convert-lib/rsvg-convert --background-color=white -o ./svg/tmp.png ./svg/tmp.svg > /dev/null 2>&1
  fbink -c -g file=./svg/tmp.png,w=1072,halign=center,valign=center > /dev/null 2>&1
fi

# Make sure the screen is fully refreshed before going to sleep
sleep 5

echo "" > /sys/class/rtc/rtc1/wakealarm
# Following line contains sleep time in seconds
echo "+3600" > /sys/class/rtc/rtc1/wakealarm
# Following line will put device into deep sleep until the alarm above is triggered
echo mem > /sys/power/state

# Kill self and spawn a new instance
/bin/sh ./bin/start.sh && exit
Disable the Kindle’s Deep Sleep
Normally, after 10 minutes of inactivity, a Kindle goes into deep sleep, without the wakeup timer enabled. This needs to be disabled,
otherwise each time the Dashboard wakes up for ~45 seconds to refresh its data, the clock is ticking …
and once 10 minutes have passed in total the Kindle goes into deep sleep permanently until the power button
is pressed. The dashboard will stop refreshing once this happens. To disable the Kindle’s deep sleep you can type ~ds
in the search bar and hit enter.
Conclusion
While I initially thought getting something to run on a Kindle would be the hard part, it turns out I was wrong… Making
sure a script runs perpetually was harder. With issues popping up only after some time, it becomes very time consuming
to pick up and fix errors. It took me quite some time to figure out that the Kindle was still going into deep sleep on
its own, realize a forgotten print statement caused a strange error in combination with a long running script and
KUAL, … Not being able to execute code directly from the extension folder also was unexpected and took a fair bit of
hacking to figure out what was going on, and where I would be able to run the program from.
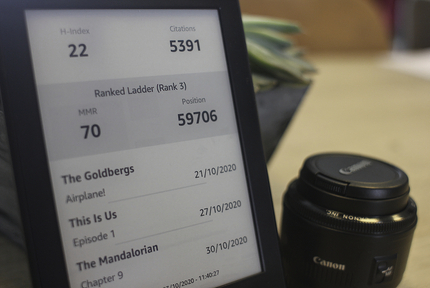
However, despite all that, the Kindle is now turned into a dashboard for my desk! Saving the device from being thrown away, mission accomplished ! Only thing to do is 3D print a nice stand for it.
Liked this post ? You can buy me a coffee