
Fighting Batch Effects with pyComBat
Even high-end scientific equipment can have a bad day! Machine performance can be affected by ambient temperature, humidity, … so when samples are measured in different batches, this needs to be corrected for. In this post we’ll have a look at the Python package pyComBat which does this elegantly and efficiently. Do note that you will need to properly randomize samples across batches. Imagine doing a study with soil samples from two different environments. To be able to correct batch effects you’ll have to make sure half of the samples of each group are in batch one, and the other in batch two. If you put all samples from group one in batch one, the correction will actually remove the differences you are trying to find. Furthermore, there need to be sufficient samples in each batch for this to work. With only a handful of measurements per batch it will not be possible to correct for the effect.
Creating a dataset
To test what pyComBat can do, a synthetic dataset can be generated with a set of measurements, and a set with a slight deviation that mimics things that can occur when measuring samples at different dates or with different equipment. Here we’ll use a dataset with values pulled from a normal distribution, and a uniformly distributed set of values. One effect will introduce is a shift, where simply all values measured in that batch are off by a constant amount and one where the values are multiplied by a constant factor. As a control, we’ll also include a feature with no effect for each distribution.
import pandas as pd
import numpy as np
import seaborn as sns
import matplotlib.pyplot as plt

num_samples = 200  # number of samples per batch

batches = ["Batch 1"] * num_samples + ["Batch 2"] * num_samples
df = pd.DataFrame(
    {
        "batch": batches,
        # Feature 1-3 are normal distributed, we'll shift one, multiply another and leave one untouched
        "feature_one": np.concatenate(
            [np.random.randn(num_samples), np.random.randn(num_samples) + 1]
        ),
        "feature_two": np.concatenate(
            [np.random.randn(num_samples), np.random.randn(num_samples) * 1.3]
        ),
        "feature_three": np.concatenate(
            [np.random.randn(num_samples), np.random.randn(num_samples)]
        ),
        # Feature 4-6 are uniformly distributed, we'll shift one, multiply another and leave one untouched
        "feature_four": np.concatenate(
            [np.random.rand(num_samples), np.random.rand(num_samples) + 0.2]
        ),
        "feature_five": np.concatenate(
            [np.random.rand(num_samples), np.random.rand(num_samples) * 1.3]
        ),
        "feature_six": np.concatenate(
            [np.random.rand(num_samples), np.random.rand(num_samples)]
        ),
    }
)
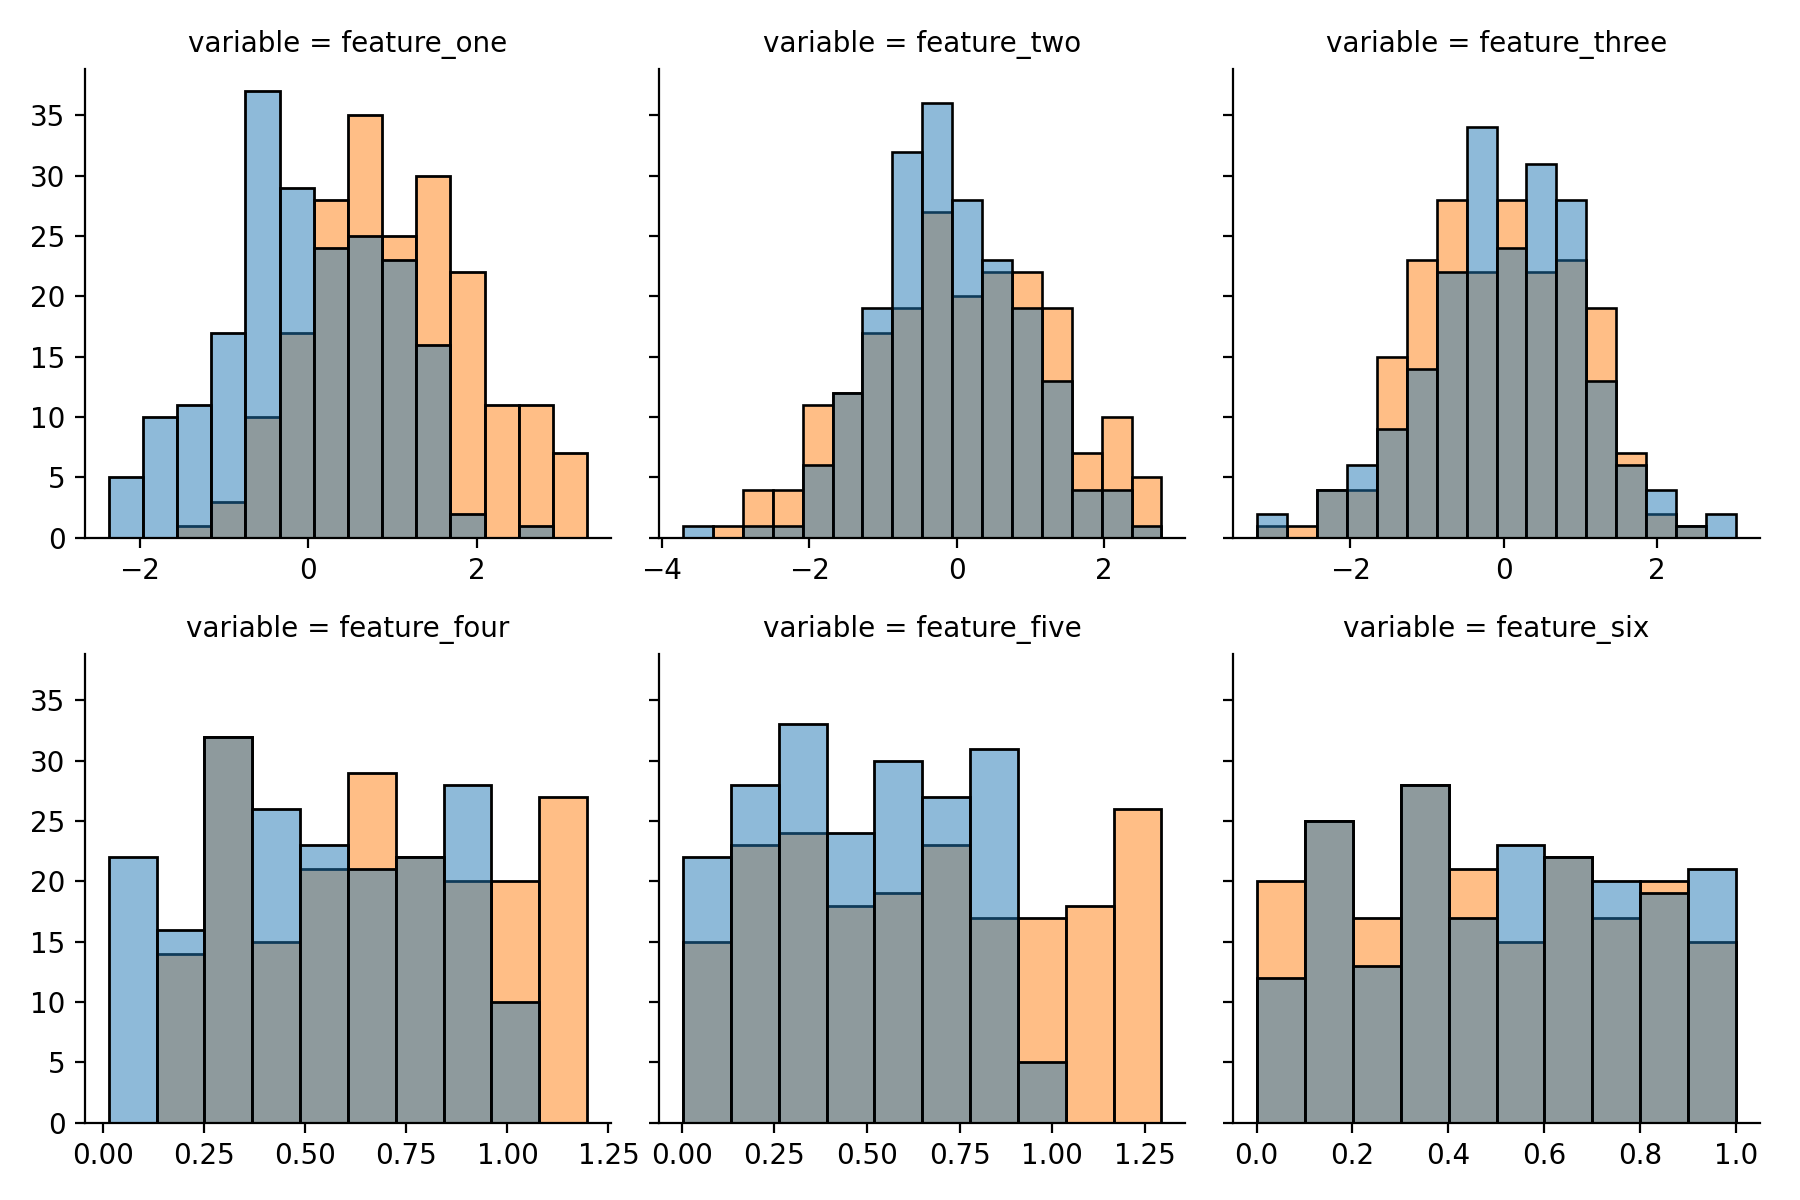
Inspecting the artificial dataset
With a few lines using Seaborn’s FacetGrid and histplot a plot can be generated to have a quick glance at
the syntethic data. For this the data needs to be converted into the long format with Pandas’ melt
function.
long_df = df.melt(id_vars=["batch"])

g = sns.FacetGrid(
    long_df, col="variable", height=3, aspect=1, sharex=False, col_wrap=3,
)
g.map_dataframe(sns.histplot, x="value", hue="batch")
plt.show()
Correcting the batch effects
The dataframe should look like the one below; one column with the batch a sample belongs to, the others with measurements that might need correcting.
| batch | feature_one | feature_two | feature_three | feature_four | feature_five | feature_six | |
|---|---|---|---|---|---|---|---|
| 0 | Batch 1 | -0.560251 | -0.329007 | -0.391515 | 0.705579 | 0.067287 | 0.318247 |
| 1 | Batch 1 | -0.676682 | -1.219296 | 0.488081 | 0.940643 | 0.786043 | 0.374624 |
| 2 | Batch 1 | 0.557334 | -0.025515 | 1.478300 | 0.851690 | 0.340614 | 0.682563 |
| … | … | … | … | … | … | … | … |
| 399 | Batch 2 | 0.253740 | -0.100651 | -0.268410 | 0.788433 | 0.740919 | 0.028127 |
| 398 | Batch 2 | -0.345181 | -0.420646 | -0.876879 | 0.327634 | 0.815336 | 0.783284 |
| 397 | Batch 2 | -0.189546 | 1.500048 | -1.136106 | 0.536194 | 1.118575 | 0.155961 |
Applying the batch correction using pyComBat is very easy, you just need to call the function with as the first argument the features and the second a list which batch each sample belongs to. With the above dataframe this can easily be done using the code below.
from combat.pycombat import pycombat

corrected_df = pycombat(df.drop(columns=["batch"]).transpose(), df["batch"]).transpose()
The result is a dataframe with the corrected features as shown below.
| feature_one | feature_two | feature_three | feature_four | feature_five | feature_six | |
|---|---|---|---|---|---|---|
| 0 | -0.062237 | -0.276713 | -0.429908 | 0.790984 | 0.089940 | 0.298606 |
| 1 | -0.180598 | -1.270888 | 0.458374 | 1.035210 | 0.921394 | 0.356112 |
| 2 | 1.073879 | 0.062193 | 1.458372 | 0.942790 | 0.406123 | 0.670221 |
| 3 | -1.299430 | -1.993188 | 1.117924 | 0.775037 | 0.635035 | 0.022828 |
| … | … | … | … | … | … | … |
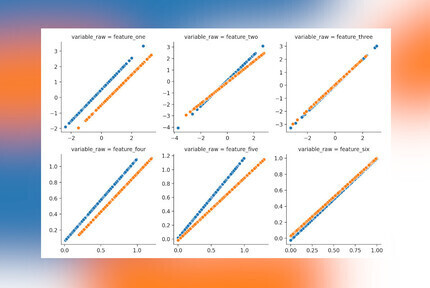
Visualizing the changes
Let’s have a look which changes pyComBat made to our data and if it makes sense! The dataframe with corrected values
also needs to be converted to a long format (again using melt), merged with the original data using merge
and plotted. Here scatterplot is used to compare the original value (x-axis) with the corrected value (y-axis) for
values from different batches (color). If no corrections were done all samples would be on the diagonal as their x- and
y-values are identical, where corrections are applied there will be a shift.
long_corrected_df = corrected_df.melt()
merged_df = pd.merge(
    long_df,
    long_corrected_df,
    left_index=True,
    right_index=True,
    suffixes=("_raw", "_corrected"),
)
g = sns.FacetGrid(
    merged_df,
    col="variable_raw",
    height=3,
    aspect=1,
    sharex=False,
    sharey=False,
    col_wrap=3,
)
g.map_dataframe(sns.scatterplot, x="value_raw", y="value_corrected", hue="batch")
plt.show()
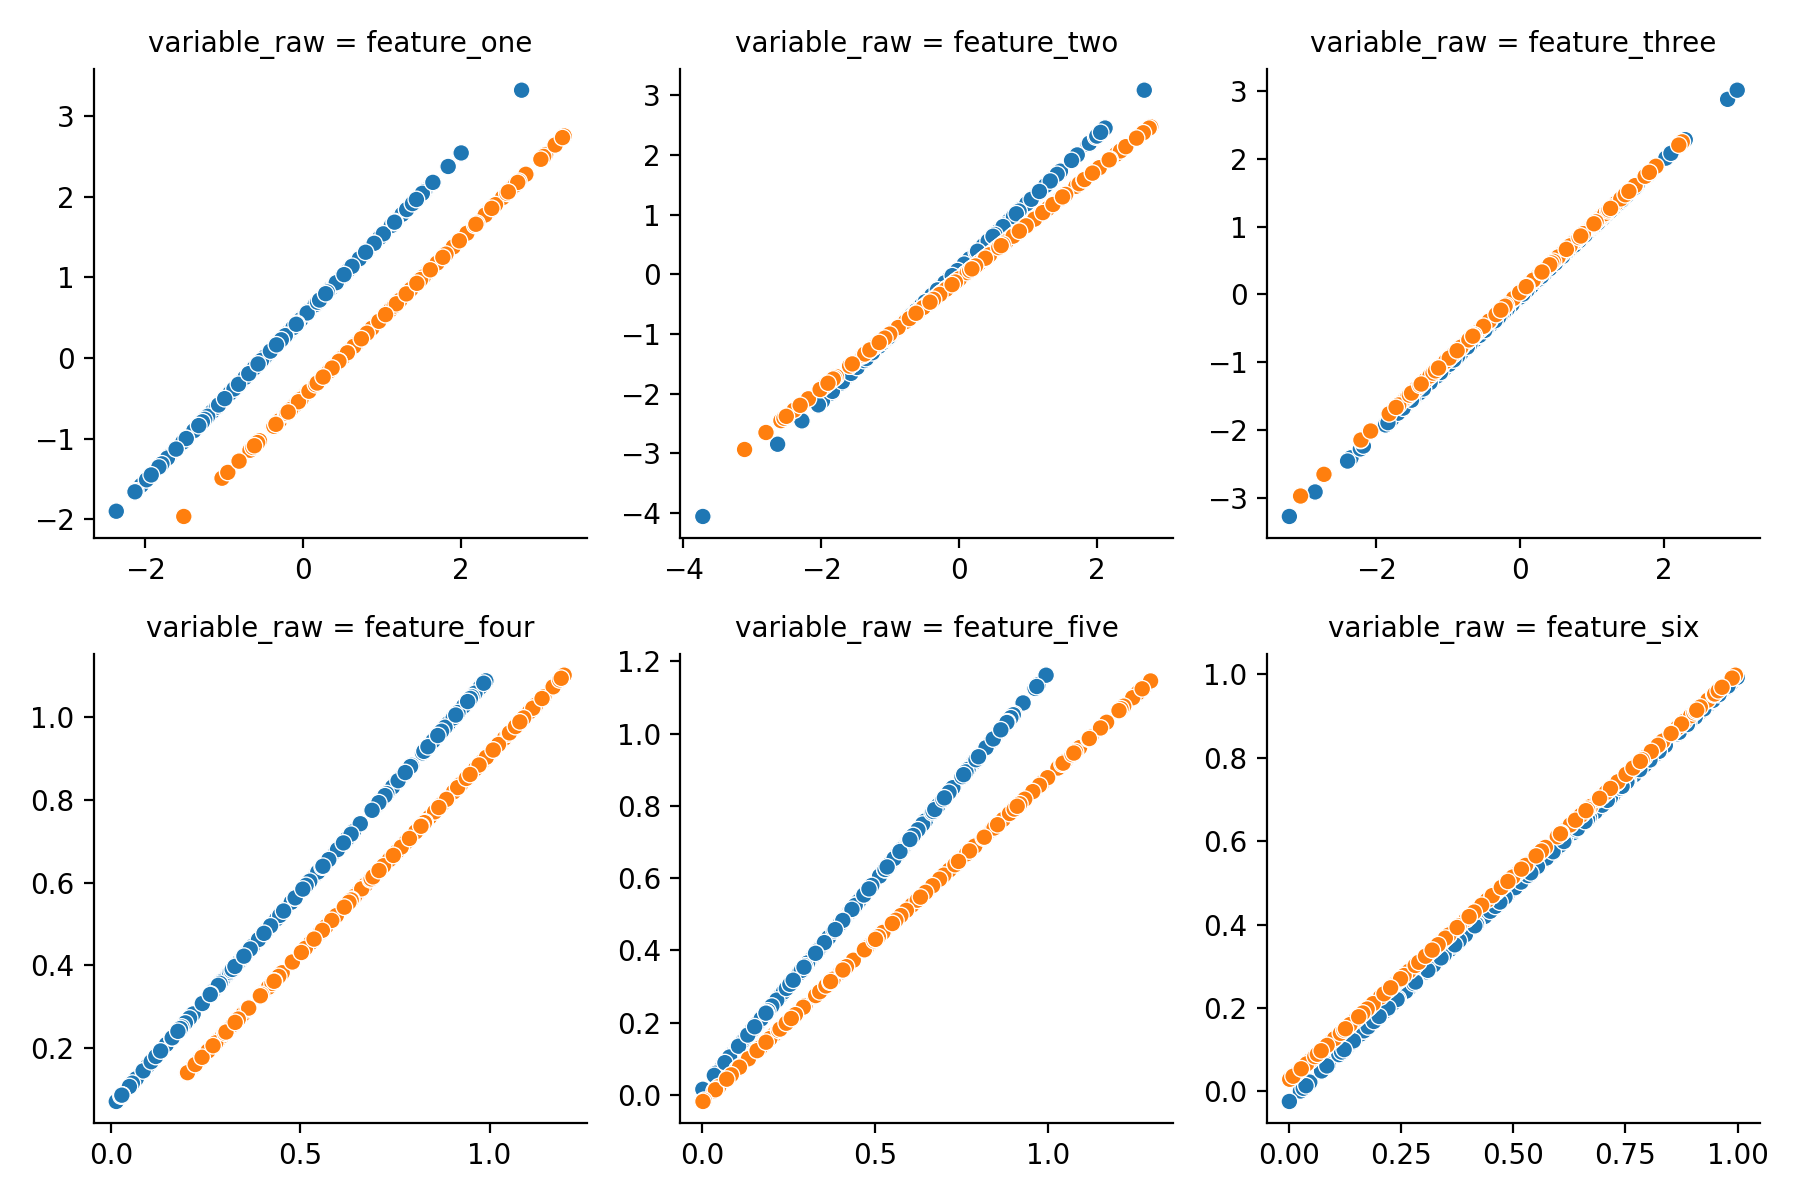
Feature one and four, which were shifted by a constant amount are corrected perfectly in both cases and feature two and five (multiplied) is handled correctly as well. Great! However, do note that a (small) correction was also applied to feature six, where there was none. Indeed, when applying corrections where they are not necessary, errors might be introduced rather than resolved, so be careful and don’t apply this nilly-willy where batch effect are not present.
Conclusion
pyComBat is a great addition to the Python data-science ecosystem! It is easy to apply and works exactly as you
would expect with Pandas’s dataframes. Whether it will be helpful for your projects will depend on (a) how many
samples there are (you can play with the num_samples parameter in the code and see the correction fail once the
number of samples is too small), (b) if they were properly randomized across batches and, (c) if there are any batch
effects present.
For more posts like this check out the Code Nuggets! These are all cookbook style posts with bits of code to tackle common data science tasks.
Liked this post ? You can buy me a coffee