
Posts tagged with Altair
-
The KeyForge hiatus: impact on deck registrations

Is has been a few months since FFG announced KeyForge would be paused, or in their words going on hiatus. Though as decks are still being registered we can get a glimpse of the effect of this announcement on the game. In a previous post, a model was made that...
-
Where are my Magic: the Gathering cards ?
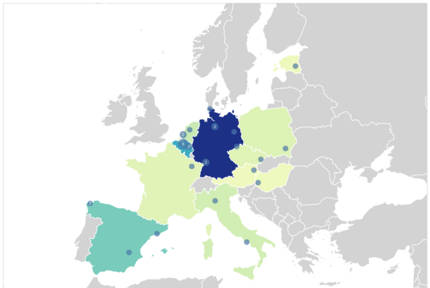
Since a few months I’ve been selling some Magic: the Gathering cards on CardMarket. Last week I realized I could extract the address from buyers from eml files (exported emails) with orders. From those the (approximate*) location using Google’s Geocoding API can be found and plotted using Altair. This gives...
-
Faster Mixture Models in PyMC3

In a previous post about clustering the palmer penguins using PyMC3, the mixture model was implemented in the model itself. Though this is great for understanding what is going on, it isn’t very efficient when sampling the model. Furthermore, observations (here penguins) were assigned to groups (here the species of...
-
COVID-19 impact on KeyForge

All our lives were impacted by COVID-19, but what was the impact on KeyForge sales? There was a very technical post last month, this one is intended for everyone that cares about KeyForge, but not the details of how to create models. 500 000 fewer decks registered during COVID This...
-
Clustering the Palmer Station penguin data, using PyMC3

This post will be all about trying to infer the species various observations originated from, without actually having access to the labels. This might sound like a far-fetched example, but it happens more often than you might expect in biology! When studying large animals you can usually find clear differences...
-
Bayesian analysis of sales data, using PyMC3
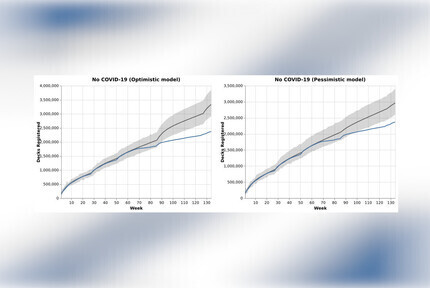
Bayesian analysis and probabilistic programming is fairly different from ‘regular’ analysis. So here I’ll take you through my first attempt at using PyMC3 to analyse sales data of KeyForge decks and explore the effects of COVID-19 restrictions and releasing new content. PyMC3 takes some getting used to, but at the...
-
Altair + Vega + Justcharts = Interactive Visualisations in Static Websites

Despite being a huge proponent of using interactive plots when publishing data visualisations on the web, the plots on this blog are all static. Using Altair, Vega and a little library justcharts all pieces finally fell into place to start practicing what I’ve been preaching on this blog as well!...